Turn every bit of data into actionable insights
Universities collect data at every stage, but without the right tools it gets scattered. Eduhub unifies it into dynamic dashboards, campaigns, and real-time reports for smarter decisions every day.

See the Whole Funnel Clearly
From first click to enrollment, all in one view

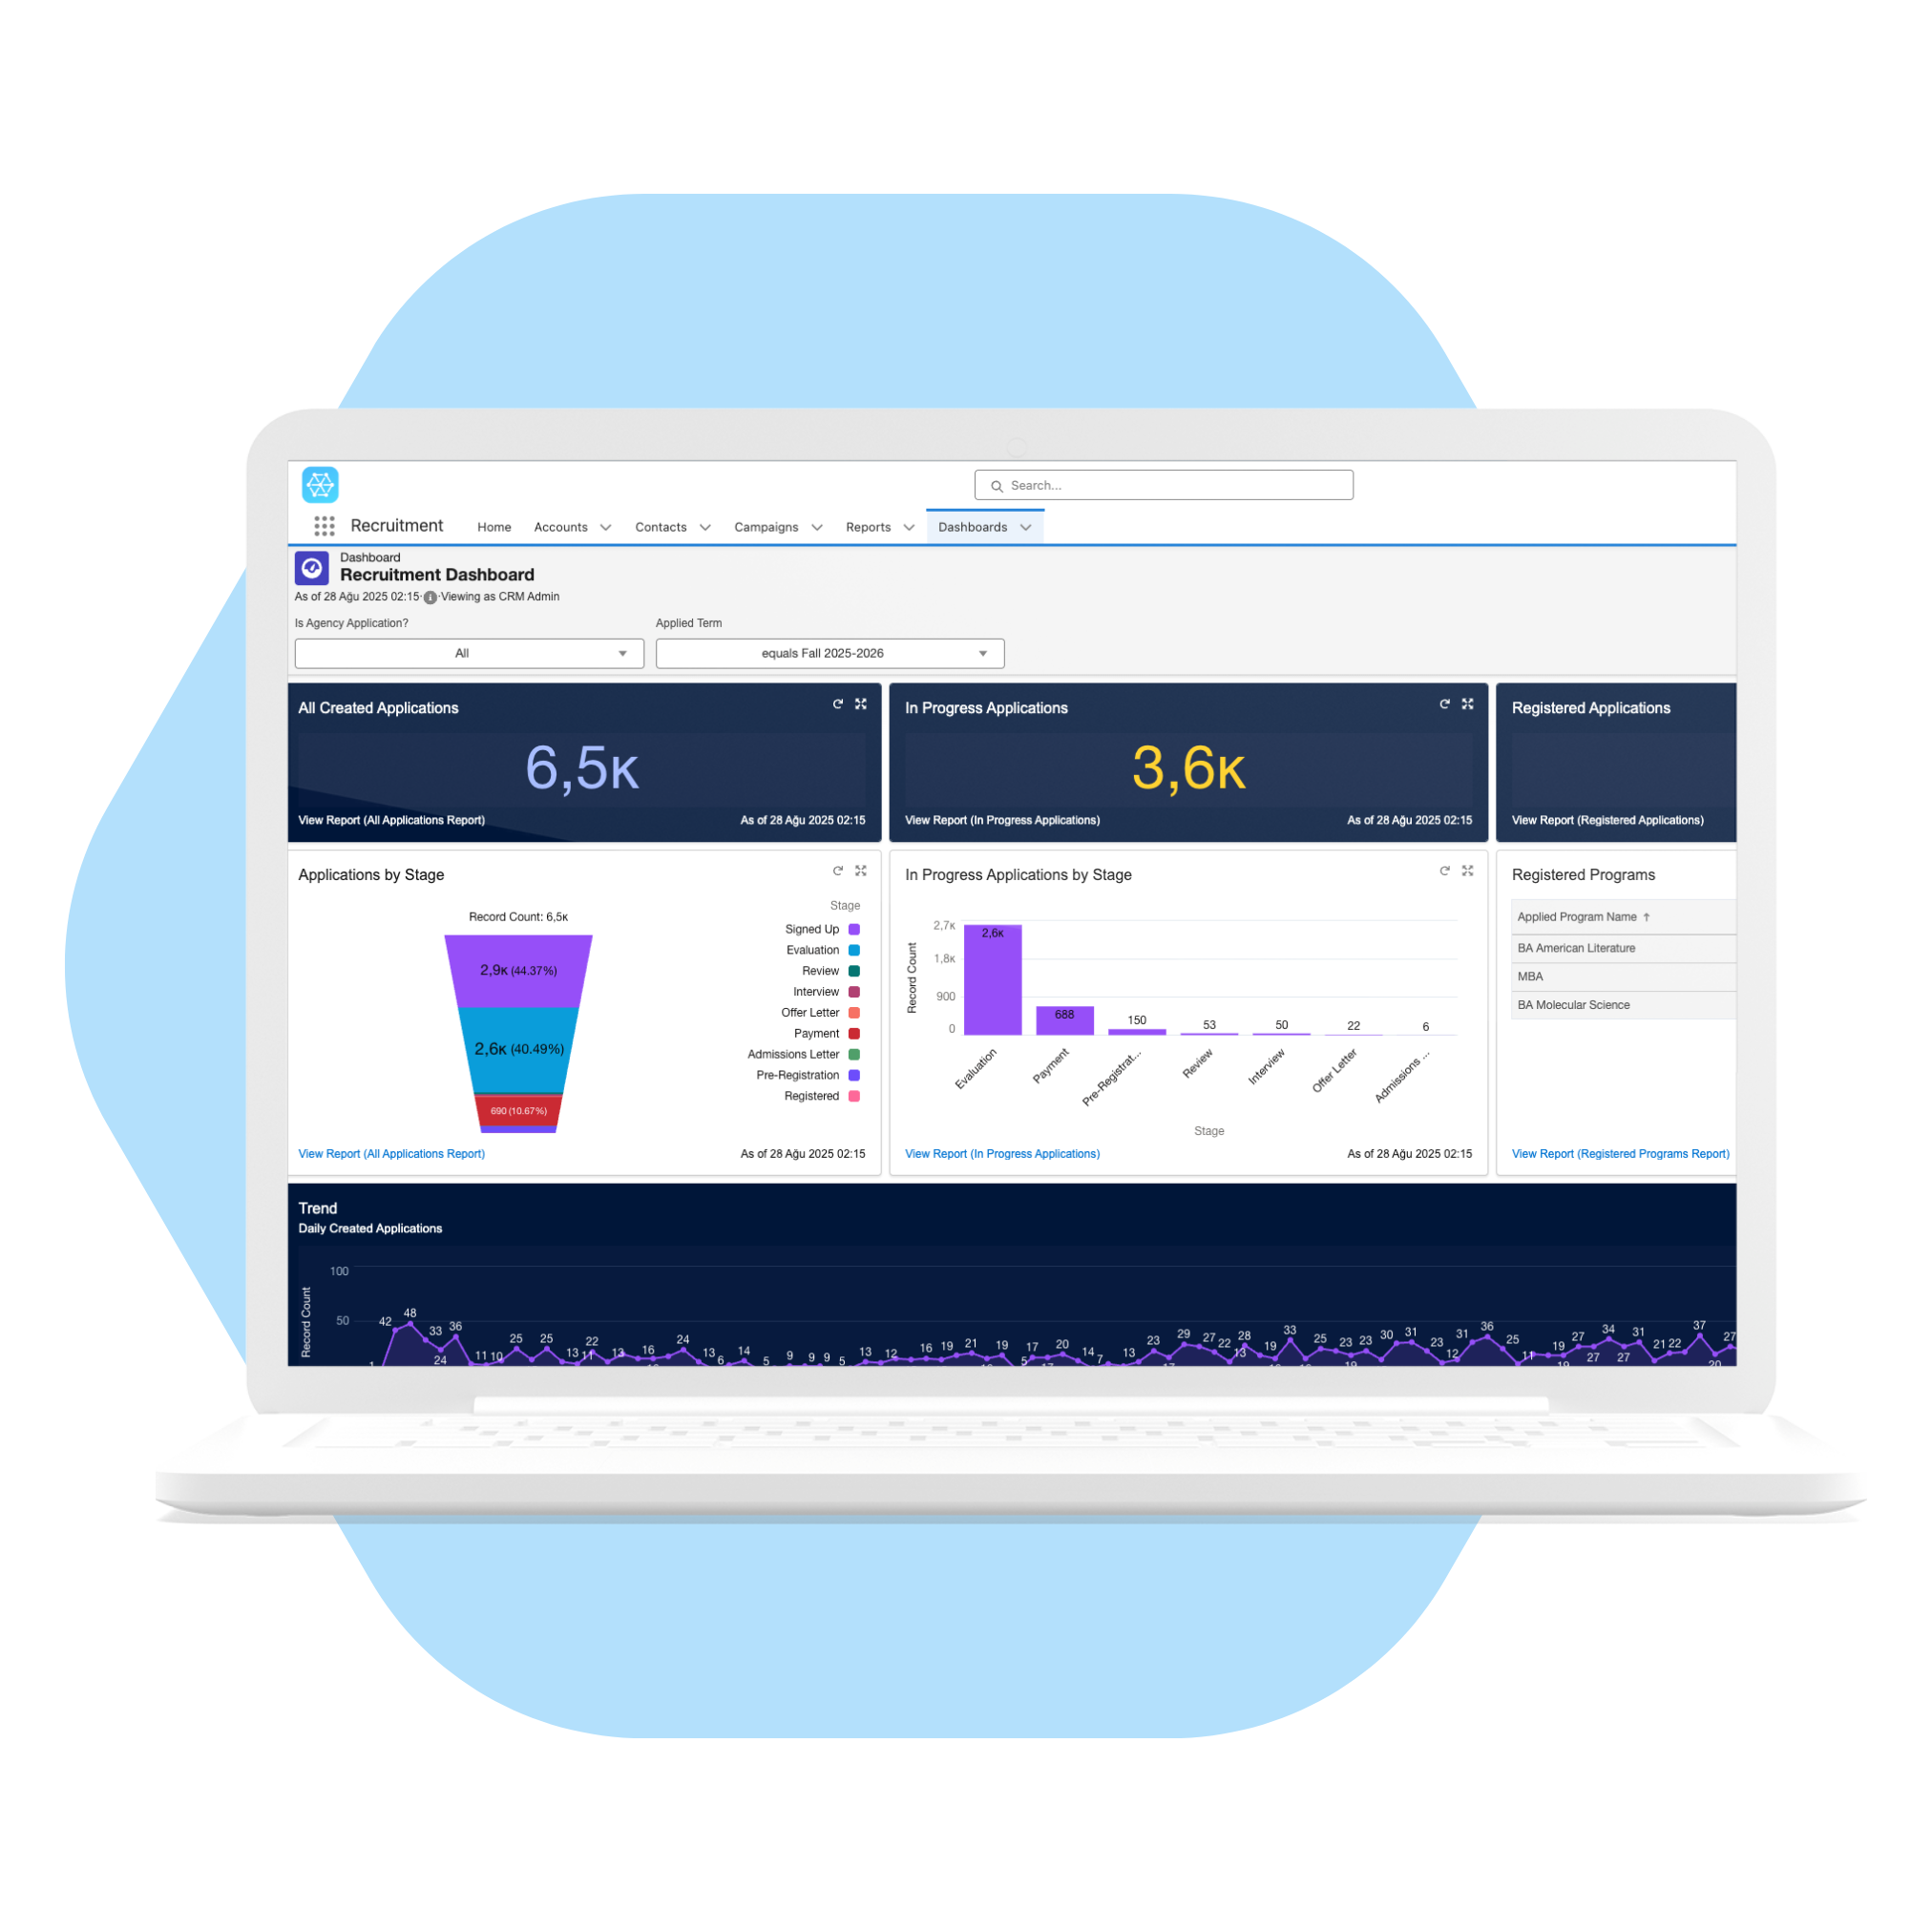
Funnel Dashboards
Visualize how prospects move from lead to enrollment.

Application Reports
Track applications by program, status, or source

Interest Trends
Understand which factors influence student interest most
Power Your Daily Decisions With Smarter Dashboards
Static reports are a thing of the past. Salesforce reports powers Eduhub’s dashboards, giving universities the ability to filter, drill down, and explore data in ways that answer real questions on the spot.
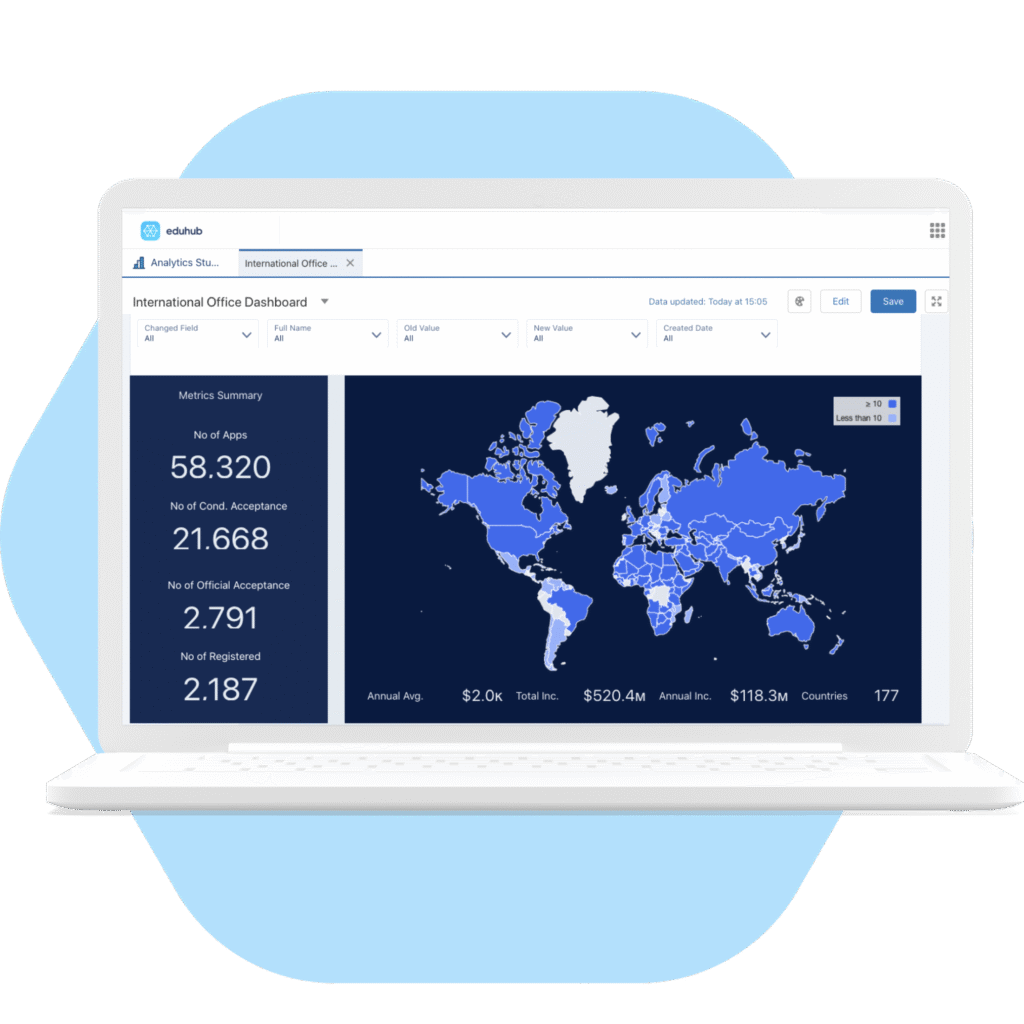
Interactive Dashboards
Filter by country, program, campaign or any other criteria instantly.
Custom Visualizations
Build charts tailored to your reporting needs and team preferences.
Real-Time Sync
Be ready with always up-to-date with live Salesforce data.
Every campaign, measured and optimized.
With Salesforce Campaigns, universities can run, compare, and refine every initiative. From ad campaigns to email pushes, you’ll know exactly what’s working and where to adjust.
- Campaign Dashboards – View performance across channels
- Engagement Reports – Track opens, clicks, and all interactions
- ROI Analysis – See the true impact of every marketing effort.


Targeted Surveys
Collect feedback at important lifecycle stages to understand student needs in context.

Visual Survey Dashboards
Convert raw responses into dynamic dashboards that make it easy to spot what matters most.

Actionable Trend Analysis
Identify recurring themes and measure satisfaction over time to guide improvements in recruitment, support, and engagement.
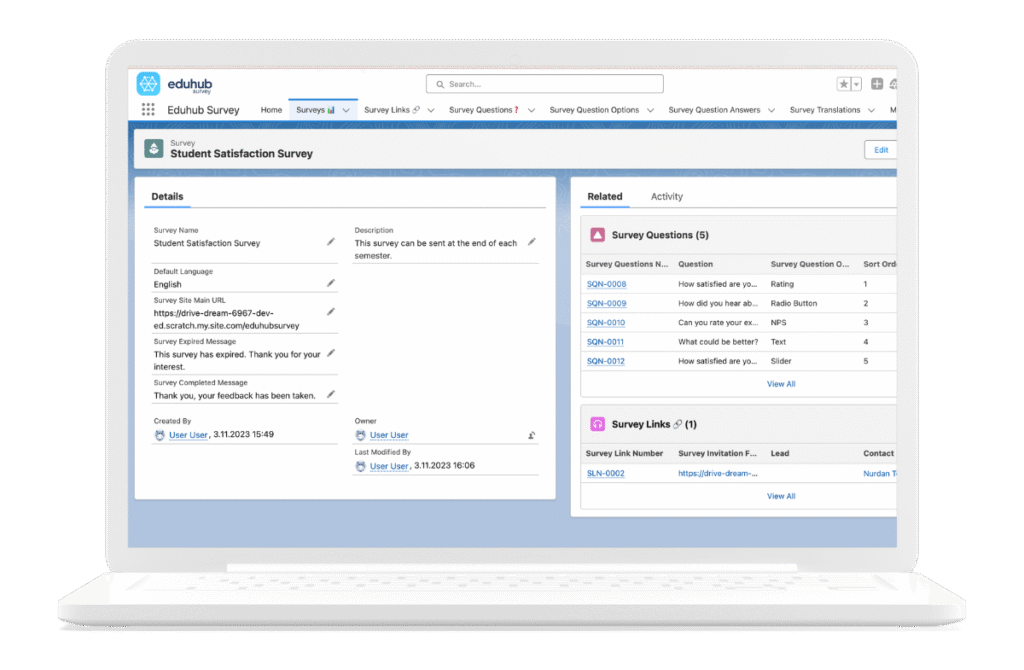
Report & Learn from Surveys
Eduhub enables universities to send targeted surveys and instantly turn responses into clear reports for smarter decision-making.
Frequently Asked Questions
Answers to the most common questions about reporting and analytics with Eduhub.
What kind of data can Eduhub report on?
Eduhub provides dashboards and reports for every stage of the student lifecycle from leads and applications to enrollment, payments, surveys, and alumni engagement.
Can universities track financial performance?
Yes. reports support revenue tracking, tuition price list management, and financial reporting, allowing universities to understand income streams and program performance clearly.
How often are dashboards updated?
Salesforce dashboards are dynamic and always in sync with real time data. This means universities see real-time data without waiting for manual updates.
Can reports be customized for different teams?
Yes. Universities can filter dashboards by criteria such as department, country, or campaign, and create custom views tailored to admissions, marketing, or finance teams.
How does reporting improve decision-making?
By consolidating all student and institutional data in one place, reports enable universities to spot trends, optimize campaigns, allocate resources wisely, and make confident, data-backed decisions.
Turn every bit of data into actionable insights
Universities collect data at every stage, but without the right tools it gets scattered. Eduhub centralizes every aspect of that data.
See the Whole Funnel Clearly
From first click to enrollment, all in one view
Funnel Dashboards
Visualize how prospects move from lead to enrollment.
Application Reports
Track applications by program, status, or source
Interest Trends
Understand which factors influence student interest most
Power Your Daily Decisions With Smarter Dashboards
Static reports are a thing of the past. Salesforce reports powers Eduhub’s dashboards, giving universities the ability to filter, drill down, and explore data in ways that answer real questions on the spot.
Real-Time Sync
Be ready with always up-to-date with live Salesforce data.
Interactive Dashboards
Filter by country, program, campaign or any other criteria instantly.
Custom Visualizations
Build charts tailored to your reporting needs and team preferences.
Every campaign, measured and optimized.
With Salesforce Campaigns, universities can run, compare, and refine every initiative. From ad campaigns to email pushes, you’ll know exactly what’s working and where to adjust.
- Campaign Dashboards – View performance across channels
- Engagement Reports – Track opens, clicks, and all interactions
- ROI Analysis – See the true impact of every marketing effort.
Targeted Surveys
Collect feedback at important lifecycle stages to understand student needs in context.
Visual Survey Dashboards
Convert raw responses into dynamic dashboards that make it easy to spot what matters most.
Actionable Trend Analysis
Spot recurring trends and measure satisfaction over time to improve your efforts.
Report & Learn from Surveys
Eduhub enables universities to send targeted surveys and instantly turn responses into clear reports for smarter decision-making.
Frequently Asked Questions
Answers to the most common questions about reporting and analytics with Eduhub.
What kind of data can Eduhub report on?
Eduhub provides dashboards and reports for every stage of the student lifecycle from leads and applications to enrollment, payments, surveys, and alumni engagement.
Can universities track financial performance?
Yes. reports support revenue tracking, tuition price list management, and financial reporting, allowing universities to understand income streams and program performance clearly.
How often are dashboards updated?
Salesforce dashboards are dynamic and always in sync with real time data. This means universities see real-time data without waiting for manual updates.
Can reports be customized for different teams?
Yes. Universities can filter dashboards by criteria such as department, country, or campaign, and create custom views tailored to admissions, marketing, or finance teams.
How does reporting improve decision-making?
By consolidating all student and institutional data in one place, reports enable universities to spot trends, optimize campaigns, allocate resources wisely, and make confident, data-backed decisions.